

Record GAAP and Adjusted Net Revenue for Fourth Quarter and Full Year 2022
Fourth Quarter $457 Million GAAP Net Revenue Up 60% Year-over-Year; $443 Million Adjusted Net Revenue Up 58% Year-over-Year
Record Fourth Quarter Adjusted EBITDA of $70 Million Up 15.3x Year-over-Year and Up 58% Sequentially
Fourth Quarter $40 Million GAAP Net Loss Improved 64% Year-over-Year
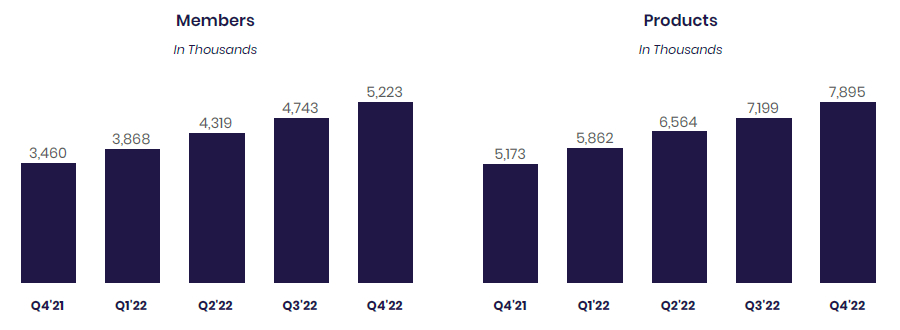
Quarterly New Member Adds of Nearly 480,000; Total Members Up 51% Year-over-Year to Over 5.2 Million
Quarterly New Product Adds of Over 695,000; Total Products Up 53% Year-over-Year to Nearly 7.9 Million
Management Announces 2023 Guidance
SAN FRANCISCO–(BUSINESS WIRE)–SoFi Technologies, Inc. (NASDAQ: SOFI), a member-centric, one-stop shop for digital financial services that helps members borrow, save, spend, invest and protect their money, reported financial results today for its fourth quarter and fiscal year ended December 31, 2022.
“We finished a remarkable year with another quarter of record financial results and continued strength in member and product adds, as well as cross-buy momentum. We generated our seventh consecutive quarter of record adjusted net revenue, which was up 58% year-over-year for the quarter and surpassed $1.5 billion for the full year, up 52% versus 2021. We also generated record adjusted EBITDA in the fourth quarter, finishing the year with over $143 million in 2022, nearly five times the total adjusted EBITDA compared to full year 2021. This strength carried through to the bottom line, resulting in an incremental GAAP net income margin of 42% for the fourth quarter and 28% for the full year,” said Anthony Noto, CEO of SoFi Technologies, Inc. “Record revenue across all three of our business segments — Lending, Technology Platform and Financial Services — drove our record fourth quarter adjusted net revenue of $443 million and record fourth quarter adjusted EBITDA of $70 million. Our continued strong growth and significant improvement in GAAP net income margin position us very well in 2023 for another year of significant revenue and EBITDA growth and for reaching GAAP net income profitability in the fourth quarter.”
Consolidated Results Summary
|
|
|
Three Months Ended December 31, |
|
% Change |
|
Year Ended December 31, |
|
% Change |
||||||||||||||
|
($ in thousands) |
|
2022 |
|
2021 |
|
|
2022 |
|
2021 |
|
||||||||||||
|
Consolidated – GAAP |
|
|
|
|
|
|
|
|
|
|
|
|
||||||||||
|
Total net revenue |
|
$ |
456,679 |
|
|
$ |
285,608 |
|
|
60 |
% |
|
$ |
1,573,535 |
|
|
$ |
984,872 |
|
|
60 |
% |
|
Net loss |
|
|
(40,006 |
) |
|
|
(111,012 |
) |
|
(64 |
) % |
|
|
(320,407 |
) |
|
|
(483,937 |
) |
|
(34 |
) % |
|
Loss per share – basic and diluted |
|
|
(0.05 |
) |
|
|
(0.15 |
) |
|
(67 |
) % |
|
|
(0.40 |
) |
|
|
(1.00 |
) |
|
(60 |
) % |
|
|
|
|
|
|
|
|
|
|
|
|
|
|
||||||||||
|
Consolidated – Non-GAAP |
|
|
|
|
|
|
|
|
|
|
|
|
||||||||||
|
Adjusted net revenue(1) |
|
$ |
443,418 |
|
|
$ |
279,876 |
|
|
58 |
% |
|
$ |
1,540,492 |
|
|
$ |
1,010,325 |
|
|
52 |
% |
|
Adjusted EBITDA(1) |
|
|
70,060 |
|
|
|
4,593 |
|
|
n/m |
|
|
|
143,346 |
|
|
|
30,221 |
|
|
374 |
% |
|
___________________ |
||
|
(1) |
Adjusted net revenue and adjusted EBITDA are non-GAAP financial measures. For more information and reconciliations to the most comparable GAAP measures, see “Non-GAAP Financial Measures” and Table 2 to the “Financial Tables” herein. |
|
Noto continued: “Our strong momentum in member and product adds, and the momentum in products added from cross-buy, reflects the benefits of our broad product suite and Financial Services Productivity Loop (FSPL) strategy. We added nearly 480,000 new members in the quarter, and ended with over 5.2 million total members, up 51% year-over-year. We also added over 695,000 new products in the quarter, and ended with nearly 7.9 million total products, a 53% annual increase.”
Noto concluded: “Total deposits at SoFi Bank grew 46% sequentially during the fourth quarter to $7.3 billion at year-end, and 88% of SoFi Money deposits (inclusive of Checking and Savings and SoFi Money cash management accounts) are from direct deposit members. We continued to see nearly half of newly funded SoFi Money accounts set up direct deposit by day 30, and average spend in the fourth quarter rose 25% versus the third quarter.
“As a result of this growth in high quality deposits, we are benefiting from a lower cost of funding for our loans. Our deposit funding also increases our flexibility to capture additional net interest margin (NIM) and optimize returns, a critical advantage in light of notable macroeconomic uncertainty. In its third full quarter of operations, SoFi Bank generated approximately $30 million of positive GAAP net income at an 11% margin.”
Consolidated Results
Fourth quarter and full-year 2022 total GAAP net revenue of $456.7 million and $1.6 billion, respectively, increased 60% in each period relative to the corresponding prior-year periods of $285.6 million and $984.9 million. Fourth quarter and full-year 2022 adjusted net revenue of $443.4 million and $1.5 billion, was up 58% and 52%, respectively, from the corresponding prior-year periods of $279.9 million and $1.0 billion, respectively. Record revenue in all three of SoFi’s business segments — Lending, Technology Platform and Financial Services — drove the robust year-over-year growth.
SoFi recorded a GAAP net loss of $40.0 million for the fourth quarter and $320.4 million for full-year 2022, marking significant improvements from the corresponding prior-year period net losses of $111.0 million and $483.9 million, respectively. Fourth quarter record adjusted EBITDA of $70.1 million increased 58% sequentially, culminating in full-year positive adjusted EBITDA of $143.3 million. Fourth quarter 2022 adjusted EBITDA was largely equivalent to fourth quarter share-based compensation expense, resulting in tangible book value growth for the second consecutive quarter.
Member and Product Growth
SoFi achieved strong year-over-year growth in both members and products for the fourth quarter and full-year 2022. New member additions of nearly 480,000 in the quarter brought total members to 5.2 million by year end, up nearly 51% from the prior year end and the company’s second highest quarter of new member adds.
New product additions of over 695,000 in the fourth quarter brought total products to nearly 7.9 million at year end, up 53% from 5.2 million at the prior year end.
In the Financial Services segment, total products increased by 60% year over year, to 6.6 million from 4.1 million in the fourth quarter of 2021. SoFi Money (inclusive of Checking and Savings and SoFi Money cash management accounts) grew 53% year-over-year to 2.2 million products, SoFi Invest grew 35% year over year to 2.2 million products, and SoFi Relay grew 107% year over year to 1.9 million products.
Lending products rose 24% year over year, driven primarily by continued demand for personal loans.
Technology Platform enabled accounts increased by 31% year over year to 130.7 million, due to both diverse new client additions and growth among existing clients.
Lending Segment Results
Lending segment GAAP and adjusted net revenues were $328.2 million and $314.9 million, respectively, for the fourth quarter of 2022, up 54% and 51%, respectively, and were each $1.1 billion for the full-year 2022, up 54% and 45%, respectively.
Fourth quarter growth in net interest income was driven by a year-over-year increase in both average interest-earning assets and average yields, slightly offset by an increase in the cost of interest bearing liabilities. This resulted in an average net interest margin of 5.92% for the quarter, up 1.39% year-over-year. Fourth quarter net interest income of $184 million exceeded noninterest income of $145 million for the first time in the company’s history, and exceeded directly attributable Lending expenses for the third consecutive quarter.
Noninterest income was relatively flat year over year as increased personal loan originations at higher weighted average coupons were largely offset by lower student loan and home loan originations. Personal loan originations in the fourth quarter grew 50% year over year to $2.5 billion, while student loan originations were down 72% and home loan originations were down 84% year over year, as a result of macroeconomic headwinds and a continued transition of home loan fulfillment partners.
Lending segment fourth quarter and full-year 2022 contribution profit of $208.8 million and $664.0 million increased 99% and 66%, respectively, from $105.1 million and $399.6 million in the corresponding prior-year periods. Contribution margin using Lending adjusted net revenue for the fourth quarter and full-year 2022 increased to 66% from 51% and to 60% from 52%, respectively, compared to the corresponding prior-year periods. For the full year 2022, net interest income covered all Lending directly attributable expenses for the first time.
|
Lending – Segment Results of Operations |
||||||||||||||||||||||
|
|
|
Three Months Ended December 31, |
|
|
|
Year Ended December 31, |
|
|
||||||||||||||
|
($ in thousands) |
|
2022 |
|
2021 |
|
% Change |
|
2022 |
|
2021 |
|
% Change |
||||||||||
|
Net interest income |
|
$ |
183,607 |
|
|
$ |
77,246 |
|
|
138 |
% |
|
$ |
531,480 |
|
|
$ |
258,102 |
|
|
106 |
% |
|
Noninterest income |
|
|
144,584 |
|
|
|
136,518 |
|
|
6 |
% |
|
|
608,511 |
|
|
|
480,221 |
|
|
27 |
% |
|
Total net revenue – Lending |
|
|
328,191 |
|
|
|
213,764 |
|
|
54 |
% |
|
|
1,139,991 |
|
|
|
738,323 |
|
|
54 |
% |
|
Servicing rights – change in valuation inputs or assumptions |
|
|
(12,791 |
) |
|
|
(9,273 |
) |
|
38 |
% |
|
|
(39,651 |
) |
|
|
2,651 |
|
|
n/m |
|
|
Residual interests classified as debt – change in valuation inputs or assumptions |
|
|
(470 |
) |
|
|
3,541 |
|
|
n/m |
|
|
|
6,608 |
|
|
|
22,802 |
|
|
(71 |
) % |
|
Directly attributable expenses |
|
|
(106,131 |
) |
|
|
(102,967 |
) |
|
3 |
% |
|
|
(442,945 |
) |
|
|
(364,169 |
) |
|
22 |
% |
|
Contribution Profit |
|
$ |
208,799 |
|
|
$ |
105,065 |
|
|
99 |
% |
|
$ |
664,003 |
|
|
$ |
399,607 |
|
|
66 |
% |
|
|
|
|
|
|
|
|
|
|
|
|
|
|
||||||||||
|
Adjusted net revenue – Lending(1) |
|
$ |
314,930 |
|
|
$ |
208,032 |
|
|
51 |
% |
|
$ |
1,106,948 |
|
|
$ |
763,776 |
|
|
45 |
% |
|
___________________ |
||
|
(1) |
Adjusted net revenue – Lending represents a non-GAAP financial measure. For more information and a reconciliation to the most comparable GAAP measure, see “Non-GAAP Financial Measures” and Table 2 to the “Financial Tables” herein. |
|
Fourth quarter Lending segment total origination volume decreased 21% year-over-year, as continued strong demand for personal loans was more than offset by lower student loan and home loan originations.
Personal loan originations of nearly $2.5 billion in the fourth quarter of 2022 were up nearly $820 million, or 50%, year-over-year. Full year personal loan originations of $9.8 billion were up 81% from 2021. This strong performance was aided by years of investment in technology to automate and accelerate the application-to-approval process for qualified borrowers and frequent testing of risk controls and underwriting models to maintain our high standard of credit quality. Fourth quarter student loan volume of approximately $406 million was down more than 50% from the average pre-pandemic volume as the moratorium on student loan payments continues to weigh on the business.
|
Lending – Originations and Average Balances |
||||||||||||||||||
|
|
|
Three Months Ended |
|
% Change |
|
Year Ended |
|
% Change |
||||||||||
|
|
|
2022 |
|
2021 |
|
|
2022 |
|
2021 |
|
||||||||
|
Origination volume ($ in thousands, during period) |
|
|
|
|
|
|
|
|
|
|
|
|
||||||
|
Personal loans |
|
$ |
2,466,094 |
|
$ |
1,646,289 |
|
50 |
% |
|
$ |
9,773,706 |
|
$ |
5,386,934 |
|
81 |
% |
|
Student loans |
|
|
405,789 |
|
|
1,461,405 |
|
(72 |
) % |
|
|
2,245,499 |
|
|
4,293,526 |
|
(48 |
)% |
|
Home loans |
|
|
105,501 |
|
|
657,304 |
|
(84 |
) % |
|
|
966,177 |
|
|
2,978,222 |
|
(68 |
)% |
|
Total |
|
$ |
2,977,384 |
|
$ |
3,764,998 |
|
(21 |
) % |
|
$ |
12,985,382 |
|
$ |
12,658,682 |
|
3 |
% |
|
|
|
|
|
|
|
|
|
|
|
|
|
|
||||||
|
Average loan balance ($, as of period end)(1) |
|
|
|
|
|
|
|
|
|
|
|
|
||||||
|
Personal loans |
|
$ |
24,917 |
|
$ |
22,820 |
|
9 |
% |
|
|
|
|
|
|
|||
|
Student loans |
|
|
46,585 |
|
|
50,549 |
|
(8 |
)% |
|
|
|
|
|
|
|||
|
Home loans |
|
|
285,152 |
|
|
286,991 |
|
(1 |
)% |
|
|
|
|
|
|
|||
|
_________________ |
||
|
(1) |
Within each loan product category, average loan balance is defined as the total unpaid principal balance of the loans divided by the number of loans that have a balance greater than zero dollars as of the reporting date. Average loan balance includes loans on the balance sheet and transferred loans with which SoFi has a continuing involvement through its servicing agreements. |
|
|
|
|
December 31, |
|
|
|||
|
Lending – Products |
|
2022 |
|
2021 |
|
% Change |
|
|
Personal loans |
|
837,462 |
|
610,348 |
|
37 |
% |
|
Student loans |
|
477,132 |
|
445,569 |
|
7 |
% |
|
Home loans |
|
26,003 |
|
23,035 |
|
13 |
% |
|
Total lending products |
|
1,340,597 |
|
1,078,952 |
|
24 |
% |
Technology Platform Segment Results
Technology Platform segment net revenue of $85.7 million for the fourth quarter of 2022 and $315.1 million for the full year increased 61% and 62% from the comparable prior year periods, or 13% and 24% growth, respectively, excluding Technisys. Contribution profit of $16.9 million for the fourth quarter of 2022 and $76.5 million for the full year declined 16% and increased 19% from the comparable prior year periods, for a margin of 20% and 24%, respectively. Excluding Technisys, contribution margin was 24% in the fourth quarter of 2022 versus 38% for the same prior-year period.
|
Technology Platform – Segment Results of Operations |
||||||||||||||||||||||
|
|
|
Three Months Ended |
|
|
|
Year Ended December 31, |
|
|
||||||||||||||
|
($ in thousands) |
|
2022 |
|
2021 |
|
% Change |
|
2022 |
|
2021 |
|
% Change |
||||||||||
|
Total net revenue – Technology Platform |
|
$ |
85,652 |
|
|
$ |
53,299 |
|
|
61 |
% |
|
$ |
315,133 |
|
|
$ |
194,886 |
|
|
62 |
% |
|
Directly attributable expenses |
|
|
(68,771 |
) |
|
|
(33,291 |
) |
|
107 |
% |
|
|
(238,620 |
) |
|
|
(130,439 |
) |
|
83 |
% |
|
Contribution Profit |
|
$ |
16,881 |
|
|
$ |
20,008 |
|
|
(16 |
)% |
|
$ |
76,513 |
|
|
$ |
64,447 |
|
|
19 |
% |
Technology Platform total enabled client accounts increased 31% year over year, to 130.7 million at December 31, 2022 from 99.7 million at December 31, 2021, as a result of new client acquisition and growth at existing clients.
|
|
|
December 31, |
|
|
|||
|
Technology Platform |
|
2022 |
|
2021 |
|
% Change |
|
|
Total accounts |
|
130,704,351 |
|
99,660,657 |
|
31 |
% |
Financial Services Segment Results
Financial Services segment net revenue increased by 195% in the fourth quarter of 2022 to $64.8 million from the prior year period’s total of $22.0 million, and by 189% for the full year to $167.7 million in 2022 from $58.1 million in the prior year.
The Financial Services segment contribution loss of $43.6 million for the fourth quarter and $199.4 million for the full year of 2022 was $8.4 million and $64.5 million, respectively, larger than the corresponding prior-year losses, largely due to our credit card business, which launched in the second half of 2020 and for which we continue to build current expected credit loss (CECL) reserves. The absolute amount of reserves is expected to increase as the business continues to grow and scale. Management expects this segment to be contribution positive by the fourth quarter of 2023 even as the company continues investing aggressively in member and product acquisition.
|
Financial Services – Segment Results of Operations |
||||||||||||||||||||||
|
|
|
Three Months Ended |
|
|
|
Year Ended December 31, |
|
|
||||||||||||||
|
($ in thousands) |
|
2022 |
|
2021 |
|
% Change |
|
2022 |
|
2021 |
|
% Change |
||||||||||
|
Total net revenue – Financial Services |
|
$ |
64,817 |
|
|
$ |
21,956 |
|
|
195 |
% |
|
$ |
167,676 |
|
|
$ |
58,078 |
|
|
189 |
% |
|
Directly attributable expenses |
|
|
(108,405 |
) |
|
|
(57,145 |
) |
|
90 |
% |
|
|
(367,102 |
) |
|
|
(192,996 |
) |
|
90 |
% |
|
Contribution loss |
|
$ |
(43,588 |
) |
|
$ |
(35,189 |
) |
|
24 |
% |
|
$ |
(199,426 |
) |
|
$ |
(134,918 |
) |
|
48 |
% |
By continuously innovating for members with new and relevant offerings, features and rewards, SoFi grew total Financial Services products by approximately 635,000 in the fourth quarter of 2022, bringing the total to approximately 6.6 million at year end. In the fourth quarter, SoFi Money added approximately 193,000 products, SoFi Invest products increased by approximately 91,000 and Relay products increased by approximately 322,000.
Upon securing a bank charter in the first quarter of 2022, SoFi launched a new Checking and Savings offering, which today has an APY of up to 3.75%, no minimum balance requirement, a host of free features and a unique rewards program. Total deposits grew 46% during the fourth quarter to $7.3 billion at quarter-end, and 88% of SoFi Money deposits (inclusive of Checking and Savings and SoFi Money cash management accounts) are from direct deposit members. Approximately half of newly funded SoFi Money accounts are setting up direct deposit by day 30, and this has had a significant impact on debit spending.
|
|
|
December 31, |
|
|
|||
|
Financial Services – Products |
|
2022 |
|
2021 |
|
% Change |
|
|
SoFi Money(1) |
|
2,195,402 |
|
1,436,955 |
|
53 |
% |
|
Invest |
|
2,158,864 |
|
1,595,143 |
|
35 |
% |
|
Credit Card |
|
171,425 |
|
91,216 |
|
88 |
% |
|
Referred loans |
|
40,980 |
|
7,659 |
|
435 |
% |
|
Relay |
|
1,921,986 |
|
930,181 |
|
107 |
% |
|
At Work |
|
65,382 |
|
33,091 |
|
98 |
% |
|
Total financial services products |
|
6,554,039 |
|
4,094,245 |
|
60 |
% |
|
___________________ |
||
|
(1) |
This product category includes Checking and Savings accounts held at SoFi Bank, which began operating in the first quarter of 2022, and cash management accounts. |
|
Guidance and Outlook
Management expects to generate $430 to $440 million of adjusted net revenue in the first quarter of 2023, up 34% to 37% year-over-year, and $40 to $45 million of adjusted EBITDA.
For the full year 2023, management expects adjusted net revenue of $1.925 to $2.0 billion, up 25% to 30%, and full-year adjusted EBITDA of $260 to $280 million. Management expects to reach quarterly GAAP Net Income profitability by Q4 2023, with GAAP Net Income incremental margins for the full year of 20%.
Management will further address first quarter and full-year 2023 guidance on the quarterly earnings conference call.
Earnings Webcast
SoFi’s executive management team will host a live audio webcast beginning at 8:00 a.m. Eastern Time (5:00 a.m. Pacific Time) today to discuss the quarter and full year financial results and business highlights. All interested parties are invited to listen to the live webcast at https://investors.sofi.com. A replay of the webcast will be available on the SoFi Investor Relations website for 30 days. Investor information, including supplemental financial information, is available on SoFi’s Investor Relations website at https://investors.sofi.com.
Cautionary Statement Regarding Forward-Looking Statements
Certain of the statements above are forward-looking and as such are not historical facts. This includes, without limitation, statements regarding our expectations for the first quarter of 2023 and full year adjusted net revenue and adjusted EBITDA, our expectations regarding the profitability of the Financial Services segment, our expectations regarding our ability to continue to grow our business, improve our financials and increase our member, product and total accounts count, our ability to navigate the macroeconomic environment and the financial position, business strategy and plans and objectives of management for our future operations. These forward-looking statements are not guarantees of performance. Such statements can be identified by the fact that they do not relate strictly to historical or current facts. Words such as “continue”, “expect”, “may”, “strategy”, “might”, “plan”, “would”, “will be”, “will continue”, and similar expressions may identify forward-looking statements, but the absence of these words does not mean that a statement is not forward-looking. Factors that could cause actual results to differ materially from those contemplated by these forward-looking statements include: (i) the effect of and uncertainties related to macroeconomic factors such as rising and fluctuating inflation and interest rates and any resurgence of the COVID-19 pandemic; (ii) our ability to achieve profitability and continued growth across our three businesses in the future, as well as our ability to achieve net income profitability in the fourth quarter of 2023; (iii) the impact on our business of the regulatory environment and complexities with compliance related to such environment, including any further extension of the student loan payment moratorium or loan forgiveness, and our expectations regarding the return to pre-pandemic student loan demand levels; (iv) our ability to realize the benefits of being a bank holding company and operating SoFi Bank, including continuing to grow high quality deposits; (v) our ability to respond and adapt to changing market and economic conditions, including recessionary pressures, inflationary pressures and interest rates; (vi) our ability to continue to drive brand awareness and realize the benefits or our integrated multi-media marketing and advertising campaigns; (vii) our ability to vertically integrate our businesses and accelerate the pace of innovation of our financial products; (viii) our ability to manage our growth effectively and our expectations regarding the development and expansion of our business; (ix) our ability to access sources of capital on acceptable terms or at all, including debt financing and other sources of capital to finance operations and growth; (x) the success of our continued investments in our Financial Services segment and in our business generally; (xi) the success of our marketing efforts and our ability to expand our member base and increase our product adds; (xii) our ability to maintain our leadership position in certain categories of our business and to grow market share in existing markets or any new markets we may enter; (xiii) our ability to develop new products, features and functionality that are competitive and meet market needs; (xiv) our ability to realize the benefits of our strategy, including what we refer to as our FSPL; (xv) our ability to make accurate credit and pricing decisions or effectively forecast our loss rates; (xvi) our ability to establish and maintain an effective system of internal controls over financial reporting; (xvii) our expectations with respect to our Technology Platform segment and our expected margins in that segment, including our ability to realize the benefits of the Technisys acquisition; and (xviii) the outcome of any legal or governmental proceedings that may be instituted against us. The foregoing list of factors is not exhaustive. You should carefully consider the foregoing factors and the other risks and uncertainties set forth in the section titled “Risk Factors” in our last quarterly report on Form 10-Q, as filed with the Securities and Exchange Commission, and those that are included in any of our future filings with the Securities and Exchange Commission, including our annual report on Form 10-K, under the Exchange Act.
These forward-looking statements are based on information available as of the date hereof and current expectations, forecasts and assumptions, and involve a number of judgments, risks and uncertainties. Accordingly, forward-looking statements should not be relied upon as representing our views as of any subsequent date, and we do not undertake any obligation to update forward-looking statements to reflect events or circumstances after the date they were made, whether as a result of new information, future events or otherwise, except as may be required under applicable securities laws.
As a result of a number of known and unknown risks and uncertainties, our actual results or performance may be materially different from those expressed or implied by these forward-looking statements. You should not place undue reliance on these forward-looking statements.
Non-GAAP Financial Measures
This press release presents information about our adjusted net revenue and adjusted EBITDA, which are non-GAAP financial measures provided as supplements to the results provided in accordance with accounting principles generally accepted in the United States (GAAP). We use adjusted net revenue and adjusted EBITDA to evaluate our operating performance, formulate business plans, help better assess our overall liquidity position, and make strategic decisions, including those relating to operating expenses and the allocation of internal resources. Accordingly, we believe that adjusted net revenue and adjusted EBITDA provide useful information to investors and others in understanding and evaluating our operating results in the same manner as our management.
Contacts
Investors:
SoFi Investor Relations
[email protected]
Media:
SoFi Media Relations
[email protected]